John O. Harney: All you can eat — interesting data From New England and beyond
From The New England Journal of Higher Education, a service of The New England Board of Higher Education (nebhe.org)
BOSTON
The ranks of New Hampshire, Vermont and Maine as the least diverse states in America, based on measures of socioeconomic, cultural, economic, household, religious and political diversity: 47th, 48th, 49th WalletHub
Ranks of Connecticut, Massachusetts, Vermont, Rhode Island, Maine and New Hampshire among the most expensive U.S. states to retire in: 3rd, 4th, 6th, 7th, 10th, 14th Bankrate
Increase in lifetime earning associated with lifetime labor union membership: $1,300,000 Parolin, Z., & VanHeuvelen, T., The Cumulative Advantage of a Unionized Career for Lifetime Earnings, ILR Review
Support for labor unions among Gen Zers (defined as being 23 years old or younger in 2020): 64% Center for American Progress
World rank of California’s economy if it were a country: 5th (soon to be 4th) Bloomberg News
Percentage of Americans who rely on autocorrect to correct misspellings: 79% Unscrambled Words
Percentage who say they judge someone who often misspells: 61% Unscrambled Words
Share of New Bedford (Mass.) High School students who were “chronically absent” in 2022, meaning they missed at least 18 days, or 10% of school: 70% The New Bedford Light on NAEP Data
Number of reports of book bans received by the nonprofit PEN America during a nine-month period from July 2021 through March 2022: 1,586 PEN America (PEN American reports 671 additional book bans during that period have come to light. A further 275 more bans followed from April through June, bringing the total for the 2021-22 school year to 2,532 bans.)
Percentage of those banned books that had a protagonist or main character of color: 41% PEN America
Percentage of those banned books that had LGBTQ themes: 33% PEN America
Number of America’s approximately 90,000 school board members who are known to be LGBTQ: 90 Victory Institute
Number of additional LGBTQ school board members who would have to be elected to match the 7% of the adult U.S. population that identifies as LGBTQ: 6,300 Victory Institute
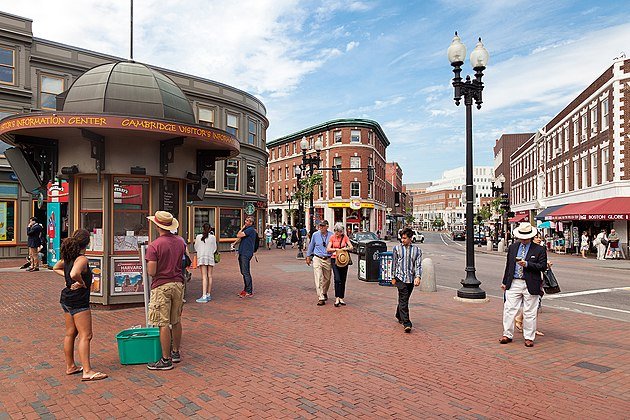
At Harvard Square, in Cambridge, Mass.
From 2010 to 2015, Harvard University’s admission rate for “legacy” applicants with at least one Harvard-educated parent: 34% Jennifer Lee, sociology professor at Columbia University, op-ed in Los Angeles Times
Admission rate for “non-legacy” applicants who do not have a Harvard-educated parent: 6% Jennifer Lee, sociology professor at Columbia University, op-ed in Los Angeles Times
John O. Harney is executive editor of The New England Journal of Higher Education.
Painting of “Still Life with Kitaj’s Death mask,” by Montserrat College of Art (Beverly, Mass.) professor Timothy Harney.


